Navigation
Navigating by gene letter
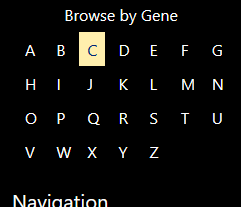
When you click a letter on the table to the left, you will be shown all genes starting with that letter that have variants associated with them.
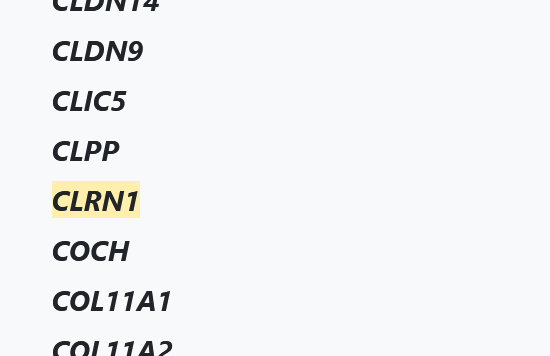
The “+” sign next to each gene indicates that you can click it to navigate to its gene page.
The Gene Page
The Gene Page offers gene level information for review on the webpage as well as filterable and downloadable variant lists. On this webpage, you are be able to view all variants associated with that gene, a CADD Phred score boxplot of pathogenicity classifications for that gene, the gene's variants in an interactive genomic browser, and view the gene's 3D protein structure. For detailed information regarding the functionality of these interactive viewers, please see their individual sections of this help page:
Navigating by the variant search bar
The search bar featured at the top of most DVD pages enables you to search for a single
specific variant, all variants at a position, all variants within a range of positions
along the same chromosome, or any combination of those three options. The search bar
hooks into the api so that a search of 13:20763071:T>C
is
equivalent to https://deafnessvariationdatabase.org/api?version=9&type=hg19coord&method=IO&format=web&terms=13:20763071:T>C
.
For more information about the supporting API call, please review the API Documentation page.
The expected return of the search bar is a loading of a new page where,
- all of the search terms are displayed under the heading "Terms searched:" and
- all of the individual searched terms are displayed as faux-gene headings with api-links to their variant list results, similar to the gene page variant lists.
- display a loading wait bar, with status messages for when the variant list data is requested from the DVD and when the data is being read into the variant list table.
- generate a table to view variant data resulting from the loaded search term(s) grouped by gene. For more information regarding use of the variant table and its capabilities please review the Variant Table Functionality Section of this page.
- Upon click of a search term heading, a grey message of "Loaded" or "No Data" will appear to the right of the clicked heading respective to the results returned by the search term.
Single Search Term Examples:
- Single specific variant search -
13:20763071:T>C
- Search for all variants at a position -
13:20763044
- Search for all variants within a range -
13:20763045-20763071
- Single specific variant not found -
X:79476000
The search bar also accepts several independent searches, separated by commas. Also, spaces are ignored. The results are in the same format as described above.
Multiple Search Term Examples:
-
Search of single specific variant and a position search -
13:20763071:T>C, 13:20763044
-
Search a range and a position search -
13:20763044, 13:20763045-20763071
-
Search a range that returns variants and a range that does not -
13:20763045-20763071,X:79477000-79477027
-
A mixture of all search permutations, found and not found -
X:79476000:C>T,X:79476000,X:79477000-79477027,1:64239701:G>A,13:20763044,16:75661649-75661755
Variant Table Functionality
Using the Variant Table
When either the 'Variant List' header or the searched term header, on a gene page or a search results page respectively, variant information will be requested from the DVD, returned, and a variant table will appear displaying the data similar to the picture shown below. To hide the variant table, click again the 'Variant List' header or the searched term header, on a gene page or a search results page respectively.
- Filtering Controls:
-
General Notes
- As seen above, applied filters are separated by the AND term and the resulting groups are color coded. Within this format, a set of complex filters can be understood at-a-glance.
-
-
There are 3 types of fields in the variant tables:
- Free Text: These fields allow you to enter free text as filter criteria.
- Controlled Selection: These fields allow you to select from a list of available values for a selected field constrained by that specific table.
- Numeric Range: These fields are numerical in nature and are treated as such when applying filters. These fields will allow you to enter in a minimum and/or maximum numeric value to filter by. For more information see below.
- Add Filter: Once you have completed the entry fields for your use case, click the "Add Filter" button. This will add the new filter to the current filter set and apply the filter set to the variant table.
- Remove Filter: By clicking the "Remove Filter" button, the filter is removed from the filter set. Then, the newly modified filter set is re-applied to the variant table.
- Clear All Filters: By clicking the "Clear All Filters" button, the entire filter set is removed from the table.
- Applied a set of OR filters:
There are 3 types of logical operators: AND, OR, and NOT.
The AND operator is applied by default while the OR operator must be selected explicitly.
The OR operator would be used if you wanted to filter down to all 'Pathogenic' OR 'Likely pathogenic' variants as seen below.
In this case, the OR filter is the 'Likely pathogenic' filter.
Below shows how an OR filter can be set (1), how it is represented once applied (2), and the string form of that applied filter (3).
- Applied min-max range filter:
Certain fields are numerically based (e.g. genomic position) and can be filtered as such.
When a numerical field is selected, the input format changes to allow for you to enter a minimum and/or maximum value as seen below.
You a valued is not entered into either the minimum or the maximum field, it is interpretted as an inifinite minimum or maximum when the filter is applied.
This is also seen in the below image where no minimum value is entered.
Below shows how a range filter can be set (1), how it is represented once applied (2), and the string form of that applied filter (3).
- Applied partial matching filter:
Certain fields are able to have a filter with terms that partially match values of that field.
For these fields, the partial matching "CONTAINS" and "DOES NOT CONTAIN" options are made available, as seen in the below image.
Below shows how a partial match can be set (1), how it is represented once applied (2), and the string form of that applied filter (3).
- Applied filters repesented as a string: All of the applied filters are also represented as a string in realtime. The fields, logic, and terms are formatted using a PubMed-like syntax. When downloading a filtered list, this string is also represented in the first line of the downloaded file. For more information, please see Downloading the Variant Table.
- Variant Specific Information:
There are two methods of viewing more detailed information for a variant by interacting with a variant table.
- Left Click - Compact Variant Overlay: Left clicking anywhere on a variant row will display an overlay with specific variant information in a compact format.
- Right Click - Full New Variant Page: Right clicking anywhere on a variant row will redirect you to a new web page with specific variant information in a more detailed format. This variant page is persistant meaning that it may be referenced and revisited using its url.
- Sorting: The variant table is sortable by column either in a ascending or descending order. The data sorted is across all data in the table (and across all pages if pagination is required). The sorting direction and column may be changed by clicking the grey arrow to the right of the column header being sorted by. Only a single column may dictate the sorting order at a time. By default when the table laods, the table is sorted in an ascending order by the 'Genomic Position' column.
- Resizeable Column Widths: By clicking and dragging the line between column headers, the columns can be resized to your preference. You can also auto-widen the column to fit the widest value in that column by double clicking the line between column headers.
- Moveable Columns: By clicking on the column header and dragging, the columns can be reorganized to fit your preference.
- Pagination:
Often, there are more variants than displayable on a single page of the variant table.
When this is the case, the variant table automatically paginates the display of the variants for more convenient viewing.
The variant table loads up to 200 variants into a single page with a scrollable 23 rows of variants shown at any one time.
To navigate between pages, use the buttons at the bottom right hand corner of the table.
On click:
- First: displays the first page of variants
- Prev: displays the previous page of variants
- 1...n: displays the nth page of variants
- Next: displays the next page of variants
- Last: displays the last page of variants
- Scrollable Table - Horizontal and Vertical: The table provides many rows and columns of data that would not be feasible to view all at once. For that reason, the table is scrollable in both horizontal and vertical directions (via the scroll bars) so that all data may be viewable.
Other Table Features
- The left two most fields are frozen for ease of access at any scroll location within the table. The 'Genomic Position (GRCh37) acts as a row identifier.
- All variants in the variant table are grouped by gene symbol. Each group of variants is then collapseable by clicking the arrow next to the gene name (ie. 'CLRN1 (7936 items)' ) within the table. To expand a collpased variant group, click the arrow again. This is especially useful on the variant search results page.
- Next to each gene symbol is a (# items) that represents total number of variants as a result of applying a filter.
- Applying all blank/empty filters to any range field applies a 0 to infinity filter that effectively filters out all variants that have empty/no-data for that field.
Table Column Descriptions
Genomic Position (GRCh37) | Variant Classification | Phenotype | HGVS Nucleotide Change | HGVS Protein Change | Protein Pos | Exon | Intron | Consequence | Impact | CADD Phred | Max MAF (%) | Max MAF Source | Interpro Domain | Motif | |
---|---|---|---|---|---|---|---|---|---|---|---|---|---|---|---|
Description | (chromosome):(position):(reference)>(alternate) | Possible values:{Pathogenic, Likely pathogenic, Unknown significance, Benign*, Likely benign, Benign} | Varying | HGVS nucleotide only nomenclature (more info) | HGVS protein only nomenclature (more info) | Protein position with reference to the citing transcript | (variant's exon) / (total number of exons in gene) | (variant's intron) / (total number of introns in gene) | Combination of VEP consequence terms (more info) | VEP impact terms Possible values:{HIGH, MODERATE, LOW, MODIFIER}(more info) | Phred-like scaled CADD score (more info) | Maximum minor allele frequency across all sources and populations as a percentage | (abbrv. source)_(abbrv. population)_AF | A list of of any overlapping protein domains at that variant's position separated by commas. | The motif identifier of a transcription factor binding profile aligned at that variant's position. |
Note | Always has a value | Always has one of the set of values | May have missing values | May have missing values | May have missing values | May have missing values | May have missing values (i.e. intronic variant) | May have missing values (i.e. exonic variant) | May have missing values. Combinations of terms separated by '&' | May have missing values. | May have missing values | Always has a value, set to 0.00000 if no data in any population from any source | May have missing values | May have missing values | May have missing values |
Downloading the Variant Table
Once a variant list is loaded (by clicking "Variant List" on a gene page or by clicking the search term on a search results page), it may be downloaded in either a comma separated value (CSV) file format or a JavaScript Object Notation (JSON) file format directly by clicking either the CSV button or JSON button in between the "Filter Variant Table" section and the actual variant table (see highlighted section of the image above).
Clicking either of these will download the variant table data including all filters applied at the time the download button was clicked.
On download, the file will be named following this convention: DVD.{the current version of the DVD}.vtable.{gene(s) delimited by '-'}.{YYYMMDD.HHmmss}.{'csv'/'json'}. For example:
CLRN1's variant table downloaded as a CSV on 11/18/2019 would be named: DVD.v9.vtable.CLRN1.20191118.134302.csv.
Understanding the filename by parsing it:
Downloading the variant table as a result of a complex search (i.e. 1:64239701:G>A,13:20763044,16:75661649-75661755) as a JSON on 11/18/2019 would be named: DVD.v9.vtable.ROR1-GJB2-KARS.20191118.135328.json.
Understanding the filename by parsing it:
Filters applied to a variant table via the website at the time of downloading are represented as a string in the first row of CSV formatted files and in the first object of JSON formatted files.
These strings follow an PubMed-like format and are represented on the website in the "Applied Filters Represented as a String" text box in realtime.
For example, the below applied filter would be represented in either file as:
Downloaded file naming conventions
How do I know which filters were applied when a file was downloaded?
{ "applied_filters": "IS Pathogenic[Variant Classification]"},
Box and Whisker Plots
Interactive Box and Whisker Plots are provided on each gene page visualizing the variants within that gene region. By default, it depicts the CADD Phred Score x Pathogenicity classifications. The boxplots are made available once a variant table is loaded for that gene. Once a variant table is loaded, the boxplot may be shown or hidden by clicking "Show Box and Whisker Plot" or "Hide Box and Whisker Plot", respectively. Furthermore, the data in the Variant Table and the that depicted in the boxplot are linked in that any filtering of the Variant Table will propogated to the boxplot.
- As mentioned previously, clicking this text will Show or Hide the Box Plot, depending on the plot's current visibility. By default the grouped by term is empty. Clicking this box reveals a drop down menu of columns from the variant table. Choosing one of these will re-render the boxplot and group the data accordingly. The axes may also be changed in a similar way by, clicking the box to reveal a drop down menu and selecting a field.
- The box and whisker plot is highly interactable via the use of the functions represented by these icons. Hovering over each of the icons will show information about its function if clicked. Additionally, you can click and drag to zoom into specific regions of the box and whisker plot.
- This key is also interactable. By clicking on any of the terms in the key, you are able to hide/show that variant classification in the plot. The plot is automatically adjust its zoom level to fit the visible data. Double clicking a term in the key will hide all other key terms and their data. Double clicking again will show all key terms and their data.
-
Hovering over any of the X axis rows will display specifics about those rows including: minimum, lower fence, quartile1, median, quartile3, upper fence, and maximum values.
-
More useful information represented in the plot:
- lower (inner) fence = quartile1 - interquartile_distance * 1.5 [Depicted in the plot]
- upper (inner) fence = quartile3 + interquartile_distance * 1.5 [Depicted in the plot]
- lower (outer) fence> = quartile1 - interquartile_distance * 3
- upper (inner) fence = quartile3 + interquartile_distance * 3
- Mild outliers (open circles) are data points that fall between either the lower inner and outer fences or the upper inner and outer fences.
- Extreme outliers (closed circles) are data points that fall outside of either the lower outer fence or the upper outer fence.
- Hovering over any outlier will reveal the Y axis value for that datapoint. This value can then be used to identify outlier variants and obtain more detailed information from the variant table.
Genome Browser Functionality
To open the genome browser, click the link-like button called 'Show Genome Browser' on the gene page. To hide the genome browser, click the link-like button called 'Close Genome Browser', which replaced the previous 'Show Genome Browser' button.
On Load
After clicking to open the genome browser, the browser will load all of the default tracks independently. Once loaded, the browser will refocus to a range around to the gene of the gene page. The gene's range itself is highlighted in a transparent green.
Genome Browser Functionality
- Add Track from Table: After the variant table is loaded, clicking this text will add the variants of the variant table as a track to the browser. The variants added are those represented in the table including all available pages of the variant table. This functionality is especially useful in combination with filtering the variant table since any filters applied to the table at the time of clicking the "Add Track from Table" will be reflected in the added browser track.
- Update Track: Similar to the "Add Track from Table" functionality, clicking this text will replace the currently selected track's data with that of the table.
- Load VCF File as Track: Similar to the "Add Track from Table" functionality, clicking this text will eventually add a new track to the browser. However, the data represented is from a local Variant Call Format (VCF) file uploaded from your local computer. Upon clicking the "Load VCF File as Track" text, a file browser window will open on your computer. Simply select the VCF file you wish to view as a track and click "Open" to add as a track. Clicking on a variant in this track will reveal a list of all INFO tags from the VCF for that variant. Important Note: All data uploaded is local to your machine meaning, it stays on your computer and is never sent to our servers.
- Specify Coordinates: In the input box is the current visible range of the format: (chromosome):(start/left-most position)..(end/right-most position). You may also search for genes by type the gene name into the field (case insensitive). Searching for a gene in this way will change the range of positions viewed and move the red highlight to encapsulate the gene's range.
- Clicking this button will remove any region highlighting from the viewer.
- Zoom: This tool bar allows you to zoom in an out on the browser. Changes in the view of the browser are reflected in the coordinates input box to the left of the tool bar. The tool bar allows for two views to be temporarily 'saved' while viewing on this page. Which of the two views you are using is indicated by the slight blue dot on the tool bar track. By default, the right dot is selected on browser load and the left dot is set to the single base zoom level. Zooming in and out may be done so in steps using the '+' and '-' magnifying glasses, respectively, at the ends of the tool bar. Additionally, zooming in or out in a sliding fashion is also possible by clicking and dragging a tool bar dot. These positions only reset to defaults if the page is reloaded or navigated away from; closing the genome browser will not reset the two zoom settings.
-
Add/Remove a Preformatted Track:
Clicking this button reveals options to add/remove tracks that have been pre-formatted tracks that we store.
For example, we prefer to use RefSeq transcripts (showing them by default), however there are times when one would like to view the more expansive list of GENCODE transcripts.
We have preformatted the GENCODE transcripts so that you can enable them quickly and easily with this functionality by clicking the checkbox next to GENCODEv19.
-
Modifying the Track Label:
Clicking this button reveals some options to modify a selected track, such as renaming it to more appropriately indicate what that track represents.
Above, the "Loaded VCF File", "Pathogenic", "Likely Pathogenic", and "Benign" labeled tracks are an example of this functionality.
-
Exporting the Browser:
Clicking this button will reveal options to export the current genome browser view enabling you to save an image or interactive "image" for later reference.
-
Help Button:
Clicking this button will reveal a small help page, shown within the browser, providing hotkey and other functionality descriptions.
- Variant Specific Information Tool Tip: Upon clicking on a variant representation in the browser, you can see a subset of the variant specific information available.
NGL Protein Viewer Functionality
- By clicking "Load NGL Viewer" or "Close NGL Viewer" the protein viewer is loaded or closed, respectively.
- On load, a pdb file is read and rendered into viewer. The filename of the structure can be seen in the top left of the NGL viewer. The filename nomenclature is as follows: (gene)_(residue/aa's n)_(isoform/transcript identifier). For example: CDH23_3354_NP_071407.4 indicates that the file loaded is for gene CDH23 containing 3354 residues/aa's for RefSeq isoform/transcript NP_071407.4 (more info). By left clicking and dragging on the structure, you can change the perspective of the structure. Also, by scrolling up or down, you can zoom in or out on the structure, respectively. By right clicking and dragging on the structure, you reposition it in the viewing window (similar to panning).
- Clicking "Structure Source Info" displays information about the structure including its source, a description about how it was generated, and its Molprobity score. Clicking "Structure Source Info" again closes the information box.
- Hovering over "Switch Structure" will show a dropdrown of structures available to render in the structure viewer. Click on one of these to load it in the Structure Viewer.
- Hovering over "Switch Representation" will show a dropdown of representations available to render the structure as. Click on one of these to render it in the Structure Viewer.
-
- Click on "Highlight Table Variants" to show variants from the Variant Table on the structure. If the variant table has not been loaded yet, no variants will be loaded. Additionally, to show variants on the structure viewer, the variants must be exonic and on the transcript of the loaded structure. If not, they will not be shown on the structure.
- You can view information of a specific residue by hovering over a part of the structure. When doing so, a grey tooltip box will appear with residue specific information. This is helpful for identifying the amino acid of a structure residue for reference in the Variant Table.
- Clicking "Clear Highlights" will remove all highlighted variants from the loaded structure.
Variant Page
Variant Page Features
Variant Description:
The Variant Description section provides Variant Call information, General Information, and Regulatory Information in a concise format encouraging efficient ingestion of the variant's descriptive data.- The Variant Call section focuses on the primary descriptions of the variant. This section includes the HGVS Protein and HGVS Nucleotide annotations, the associated gene symbol, genomic variant description, our pathogenicity classification, and associated phenotypes.
- The General Information section is an assortment of associated secondary data to giving context to the variant. This section includes: Exon/Intron information, associated publications, dbSNP information, VEP Consequence and Impact categorizations, CADD Phred score, and overlapping Interpro domains.
- The Regulatory Information section provides motif related information including Motif name, Motif position, whether or not it is in a high information position within the motif, and the motif score change as a result of the variant. Below is a snapshot of another variant with such information:
Interpretation Information:
The Interpretation Information section provides interpretation important information including: Computational Predictions and Variant Population Frequency Information.- The Computational Predictions sections displays in silico methods data that impact the classification of the variant. These are color coded by severity: Red and Orange contribute to Pathogenic and Likely pathogenic classifications, Grey indicates that no data was available or that data did not contribute to either Pathogenic or Benign classifications, and Green contributes to a classification of Benign and Likely benign.
- The Variant Population Frequency Information section organizes and displays population relevant in formation for the variant. This section has extensive organization and formatting rules to make the data easily digestible. For detailed information, please see the section specifically describing it below.
- The Other Notes section displays a mixture of additional notes about the variant such as ClinVar submission agreement, MORL curation notes, and/or classification determination notes.
Population Maximum Minor Allele Frequencies (MAFs) and Their Sources
- A population is bolded and underlined if it is the max MAF within that population source. A population is also highlighed if it is also the max MAF across all sources. Please keep in mind that the max MAF across all sources is a determining factor in variant classification. These bolding, underlining, and highlighting rules apply only to classification impacting MAF sources.
- Populations within each source are sorted with the greatest max MAF being the top-left most population and the least max MAF at the bottom-right. This applies to all populations within each source regardless of if they impacted the variant's classification.
- A source and/or any population within a source may have a *Note. This identifies it as a source/population that did not impact the variant's classification.
- Much like the sorting of populations within each source, if a population has sub-population groups, they are also sorted. Sub-population groups are sorted from top to bottom, greatest max MAF to least max MAF.
Variant Page - full vs compact
The compact view of the variant page displays most of the information in the full page does with a couple of exceptions in the appearance of the population frequency information. Above and on the left is a snapshot of a full variant page. Above and on the right is a snapshot of the compact view of that variant page. All of the previously mentioned formatting and sorting apply to both the full and compact views with the following exceptions:
- The population names are simplified and only the population's max MAF AC, AN, AF, and n homozygotes are reported - no subpopulation information is displayed.
- If one of the compact view's population frequency boxes are hovered over of clicked, the full name of that population is displayed here.
Getting Support
Please get in touch if you experience any issues with using this site.